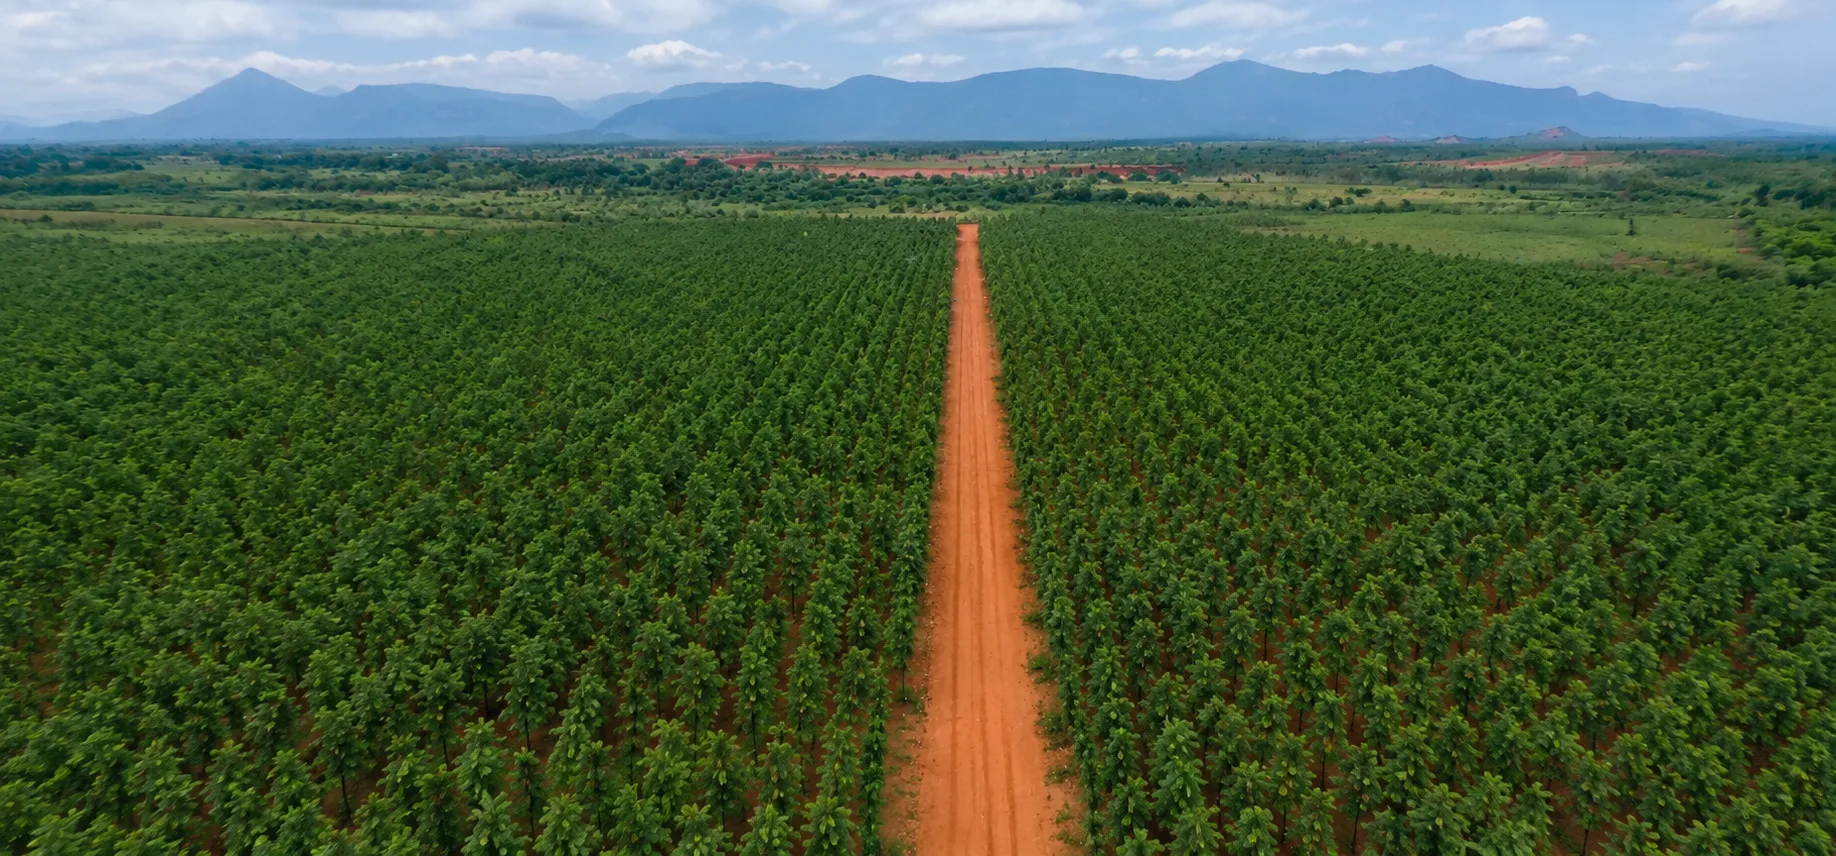
Drone surveys turn a plantation into inspectable data. Here’s what the imagery shows, and what it can’t.
Published 2025-12-22, Updated 2026-07-03, By Shree Editorial Desk
Quick answerA drone survey captures geotagged aerial imagery of a plantation, typically an orthomosaic (a stitched, map-accurate image) showing canopy cover and condition across blocks. It’s a powerful transparency tool: it lets you see your plot from above, track canopy development over time, and target ground inspections. But it has limits, it shows the canopy, not the heartwood inside a tree, and imagery quality varies. This article explains what a drone report shows, how to read it, and why it complements rather than replaces on-the-ground verification.
What a drone survey captures
A geotagged orthomosaic, a map-accurate stitched image of the blocks.
Canopy cover and visible health across the plantation.
Change over time, when surveys are repeated (e.g. quarterly).
How to read it
Look at canopy density and consistency across blocks, and compare successive surveys to see development. Geotags let you locate your specific plot. Stressed or bare patches flagged for ground checks show active management.
What it can’t show
A drone sees the outside, not the inside, it cannot measure the heartwood that holds the value, and it cannot replace physically walking the plots. Imagery quality and interpretation also vary.
Use it as one layer
Drone reports are strong evidence of a genuinely monitored plantation, best combined with survival reports and a site visit. See our technology page for the wider monitoring stack.
SH
Shree Editorial Desk
Shree Properties & Projects, editorial
Run the ten checks on us
Request the due-diligence pack and hold us to this guide.